
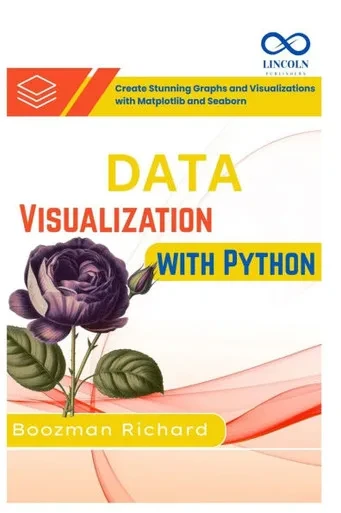

Data Visualization with Python: Create Stunning Graphs and Visualizations with Matplotlib and Seaborn
Paperback or Softback 00222 pages May 20, 2025
(No reviews yet)
Write a Review
Write a Review
Independently Published
Data Visualization with Python: Create Stunning Graphs and Visualizations with Matplotlib and Seaborn
Millions of titlesEvery book you're looking for
Carbon-neutral shippingFree on orders over $39.99
Fast shipping worldwideDelivered to your door
Master the art of turning raw data into compelling, easy-to-understand visuals with this practical guide to data visualization using Python. Whether you're a beginner or experienced programmer, this book walks you through creating beautiful, insightful charts and graphs using two of Python's most powerful libraries: Matplotlib and Seaborn.Through clear explanations and hands-on projects, you'll learn how to visualize your data effectively to uncover patterns, trends, and insights that drive better decisions.What you'll learn: Fundamentals of data visualization and why it mattersSetting up your Python environment for visualization tasksCreating basic plots like line, bar, and scatter charts with MatplotlibEnhancing your charts with labels, legends, and stylesUsing Seaborn to create statistical graphics and advanced visualizationsVisualizing distributions, relationships, and categorical dataCustomizing plots with themes, color palettes, and annotationsBuilding multi-plot layouts and dashboardsExporting and sharing your visualizations in various formatsBest practices for choosing the right chart type for your dataBy the end of this book, you'll be able to create stunning, informative visualizations that make your data speak clearly and powerfully.Perfect for data analysts, scientists, and anyone wanting to master data visualization with Python.
- Author:
- Boozman Richard Richard
- Publisher:
- Independently Published
- Publication Date:
- May 20, 2025
- Number of pages:
- 00222 pages
- Binding:
- Paperback or Softback
- ISBN-10:
- NA
- ISBN-13:
- 9798284569436